
For more than 10 years, we have been concerned by the quality of the data included in the TP53 database [Soussi and Beroud, 2001, 2003; Soussi et al., 2005, 2006a, 2006b; Edlund et al., 2012]. To circumvent obviously biased manual curation, we have developed and refined several statistical procedures to provide a highly curated set of TP53 mutations.
Mutant diversity in the database can be apprehended from two angles: TP53 variants can be considered i) irrespectively of the context of the mother publication, or ii) they can be investigated in relation to the other variants described in the same publication.
TP53 mutant analysis
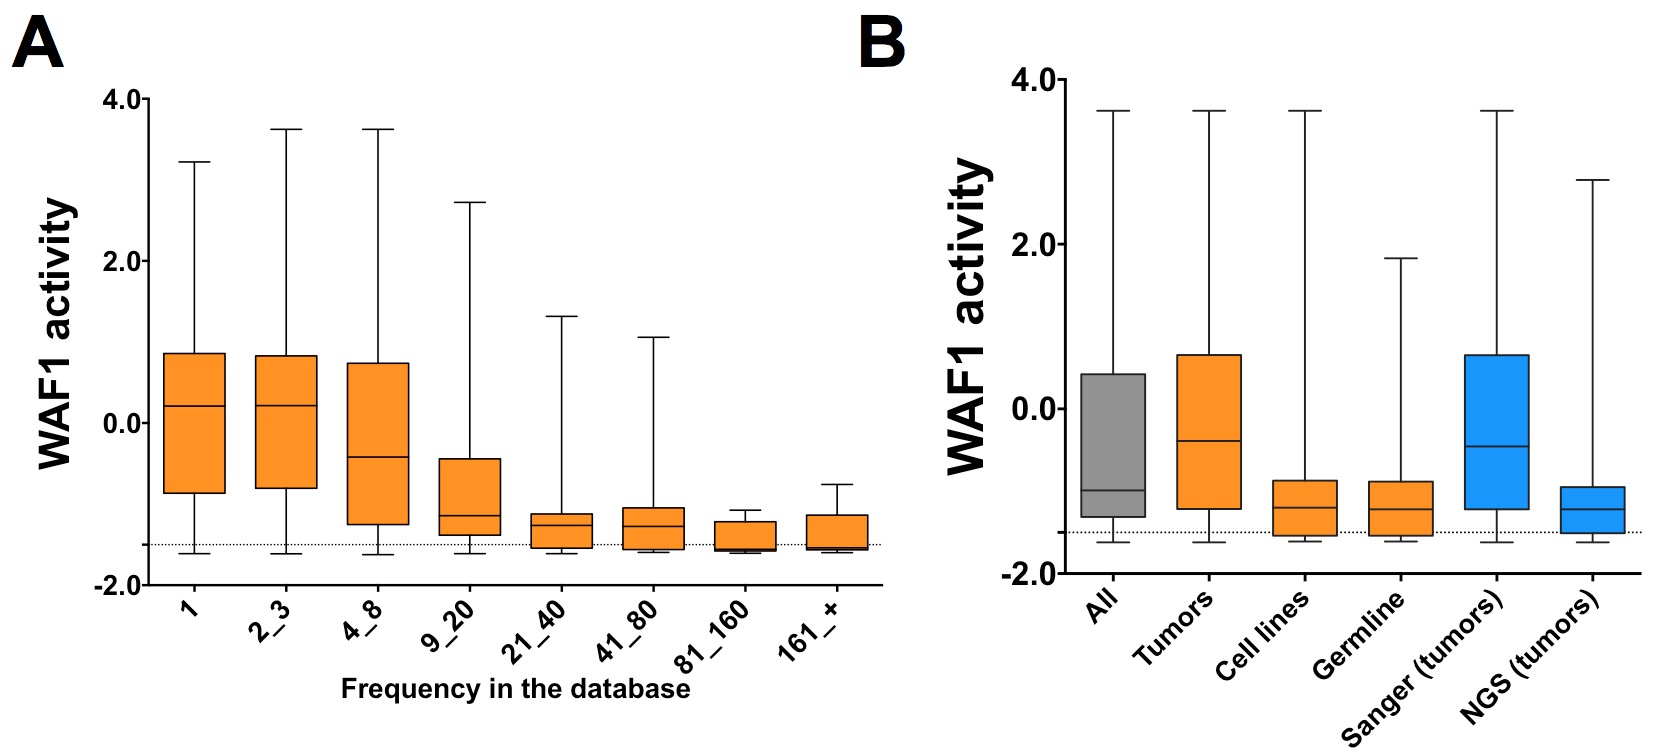
The most uncontested and solid information for TP53 variants is their frequency in the database. Five missense variants are found more than 1,000 times and 61 between 100 and 1,000 times. Combining a functional analysis with a determination of the frequency of each mutant in the entire database leads to the striking observation of a clear inverse correlation between the frequency of TP53 mutants and their activity: frequent TP53 mutants are always inactive, whereas approximately half of the mutants reported only once have activity greater than 50% compared with wild-type TP53, further underlining the very limited importance of these mutations during transformation.
From Soussi, T., Kato, S., Levy, P.P. & Ishioka, C. (2005). Reassessment of the TP53 mutation database in human disease by data mining with a library of TP53 missense mutations.Hum Mutat 25: 6-17
|
Activity of mutant TP53 according to their frequency in the data base. Each TP53 mutant is associated with a quantitative value assessed in a yeast assay (Kato et al., 2003). The activity without p53 or with wild-type p53 was -1.5 and 2.5, respectively and the activity of the majority of TP53 mutants was situated between these two values. Box-and-whisker plots show the interquartile range (boxes), median values (horizontal lines inside the boxes), and full-range distributions (whisker lines) for TP53 activity. All: entire database; tumors: tumors only; cell lines: cell lines only; germline: germline only; Sanger (tumor): tumors analyzed by conventional DNA sequencing; NGS (tumors): tumors sequenced by NGS (mostly from frozen samples). |
Meta-analysis of the p53 Mutation Database for Mutant p53 Biological Activity
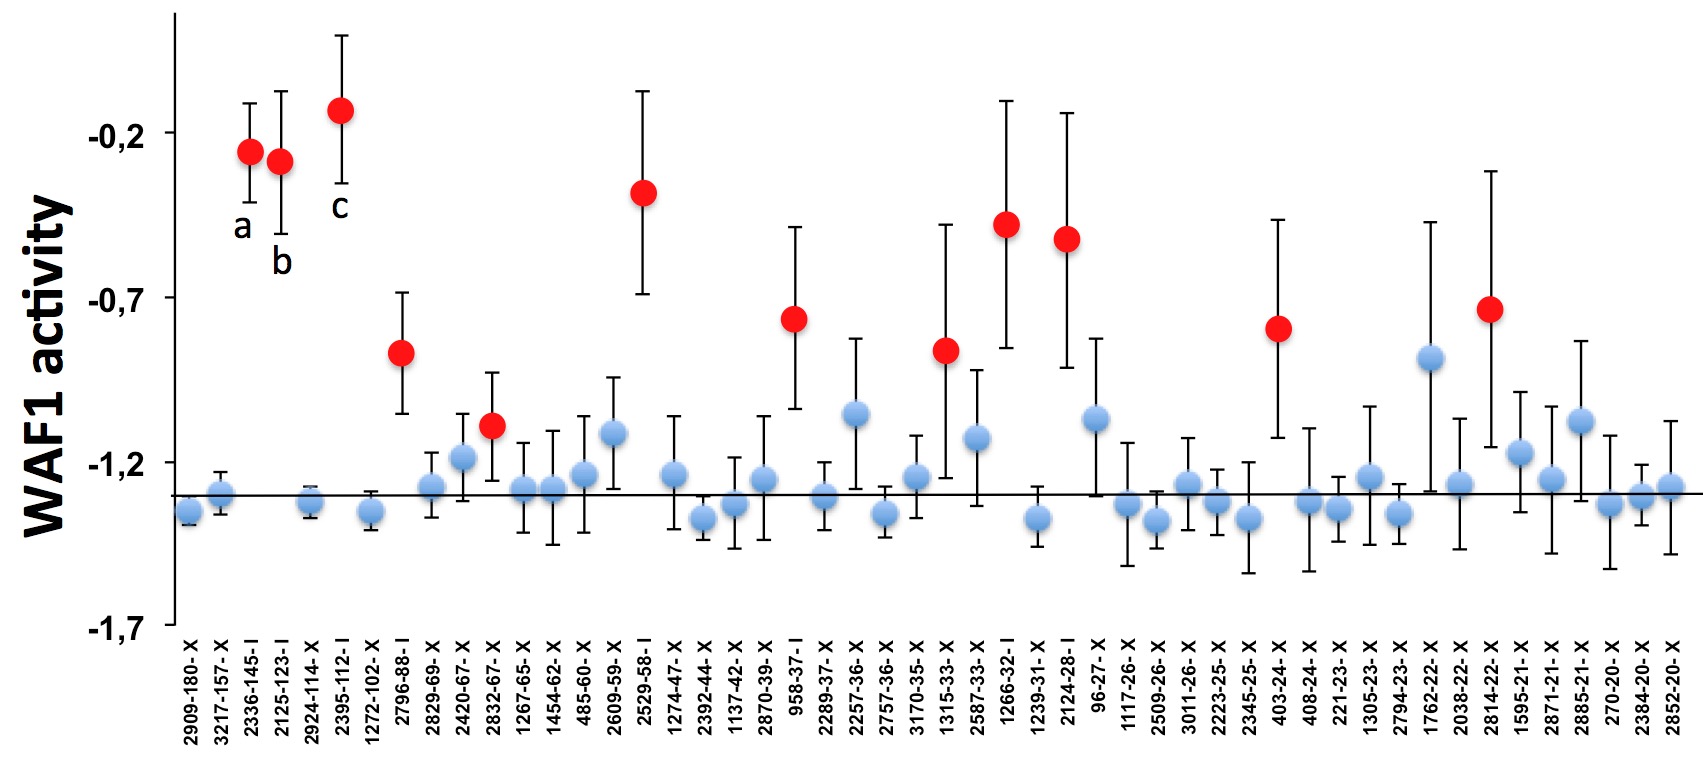
By using an approach similar to that of clinical meta-analyses, we clearly showed that several published studies have a p53 mutant activity profile that differs significantly from the normal distribution observed in other studies and can have a profound effect on the analysis of the p53 mutation database.
From Soussi, T., Asselain, B., Hamroun, D., Kato, S., Ishioka, C., Claustres, M., and Beroud, C. (2006). Meta-analysis of the p53 mutation database for mutant p53 biological activity reveals a methodologic bias in mutation detection. Clin Cancer Res 12, 62-69.
|
Meta-analysis of publications reporting TP53 mutations in breast carcinoma. Dots: for each publication, the quantitative value of all TP53 mutant was averaged. bars: 95% Confidence interval (CI). Horizontal line, mean of the combined studies. The publication code is indicated on the x-axis: the first number is an anonymous ID for the publication and the second is the number of p53 mutants included in that study. Studies are presented from left to right in decreasing order of the number of TP53 variants they described. The y-axis corresponds to TP53 transactivation activity. Only studies reporting 20 or more TP53 mutations are shown on this graph. a: publication associated with a high frequency of tumors with more than one mutation (30%), mutants with significant activities (60%) and an unusual hot spot of mutations; |
Since 2005, the UMD_TP53 database has been curated and provides the scientific community with specific tools to assess the confidence of each TP53 mutant.
In 2012, we performed a novel statistical analysis of the last release of the TP53 mutation database using an original multivariate criteria strategy. The use of multiple independent criteria allowed a strong and robust analysis and led to a marked improvement of the quality of the UMDTP53 database.
( Edlund K, Larsson O, Ameur A, Bunikis I, Gyllensten U, Leroy B, Sundstrom M, Micke P, Botling J, Soussi T (2012) Data-driven unbiased curation of the TP53 tumor suppressor gene mutation database and validation by ultradeep sequencing of human tumors.Proc Natl Acad Sci U S A 109: 9551-9556)
Criteria used for ranking publications in the TP53 mutation database
| Criteria | Description | Possible origine of the variation 1 | Comment |
|---|---|---|---|
|
1This refers to the variation observed in a single study. 2Natural exonic polymorphisms are not included in the database (P72R: rs1042522; R213R: rs1800372; P47S: rs1800371). Mutant (c.375G>T) T125T, erroneously reported in various publications and in the SNP database as a natural SNP, is not included in this category as it has been experimentally demonstrated to be detrimental for TP53 gene splicing. 3Increase of TP53 mutations in tumors with,genetics instability has never been observed. The frequency of TP53 mutations in low in HNPCC harboring a defect of DNA mismatch repair. 4Except for liver cancer (R249S), no cancer specific hot spot for TP53 mutation have been associated. 5The majority of TP53 hot spots for mutations are associated with GC->AT transition, at methylated CpG dinucleotide and are detected in all types of cancer. High frquency of mutations at codons 249 and 157/158 are associated with carcinogen exposure in liver and lung cancer, respectively. |
|||
|
Activity (ACT) |
TP53 mutant transcriptional activity monitored in a yeast assay | Low frequency: passenger mutations
High frequency: spurious mutations |
TP53 mutants associated with significant remaining activity are predominantly found among infrequent mutations in the database |
| Synonymous mutations (SYN) | Mutations that do not change the amino acid 2 | Low frequency: passenger mutation; mutation with an unknown consequence on RNA stability or translation
High Frequency: spurious mutations |
Publications reporting a high frequency of tumors with SYN mutation (up to 50%) are also associated with a high frequency of multiple mutations per sample |
| Multiple mutations (EVT) | Tumors that contain more than one TP53 mutation | Low frequency: passenger mutation;
association of two cooperating weak mutants; tumor with a hypermutator phenotype3 High Frequency: spurious mutations |
Tumors with multiple TP53 mutations are not associated with any specific cancer type |
| Recurrence (REC)4 | Publications that report identical mutations in multiple tumrs while the mutations are either infrequent or absent from the database | Reproducible finding: association with carcinogen exposure
Irreproducible finding: spurious mutations ot contamination |
Several novel hot spots have never been confirmed in subsequent studies (e.g. P89S is found 25 times in the database but 22 times in a single publication) |
| Frequency (FREQ) | Frequency of the mutant in the database. TP53 mutation frequency in the database ranges from 1300 for hot spot mutations to 1 for infrquent mutants5 | Low frequency: passenger mutations High frequency: spurious mutations |
Hot spot mutations are more likely associated with driver mutations, whereas infrquent mutations could be passenger mutations. |
Principal component analysis (PCA) was used in order to evaluate all of these criteria in a combined analysis. The first four components captured 66% of the total variance and were therefore used to calculate the number of standard deviations (SD) by which each sample deviated from the median. We identified 129 studies (9.7%) that deviated from the median by >2 SD. This SD value has been included in the database to allow each user to work with his or her own dataset.